How to Measure & Improve Construction Equipment Utilization
- William Hipp
- May 28, 2025
Construction equipment utilization measures how effectively contractors use their machinery assets across projects. The measure represents the percentage of available time that excavators, dozers, trucks, and other heavy equipment or heavy trucks actively work on jobsites versus sitting idle in yards or on standby at other projects.
Tracking utilization directly impacts your bottom line. When you can identify underused assets, you prevent unnecessary equipment rental costs and maximize return on owned equipment.
For instance, avoiding three to six months of rental costs for a single Komatsu PC238 Mini Excavator (at $6,500 per month) by deploying an underutilized owned unit could yield savings of at least $20,000. This is for just one piece of rental equipment. Imagine what those savings could look like across an entire fleet.
In this article, we’ll explore how to accurately measure construction equipment utilization across your mixed fleet. You’ll learn practical methods to transform utilization data into operational improvements.
You’ll also see how Tenna’s equipment utilization software provides the visibility you need to track, analyze and optimize your equipment usage patterns — helping you reduce costs and improve bidding accuracy.
How to Measure Your Construction Equipment Utilization
Effective equipment utilization measurement starts with a consistent formula. The standard utilization rate formula is:
Utilization Rate = (Actual Hours Used / Available Hours)
For construction equipment, “Actual Hours Used” typically refers to engine hours or operational time, while “Available Hours” represents the total time the equipment could potentially be working (excluding scheduled maintenance and repairs). Common practice for single shift jobs is 40 hours per week.
“Available Hours” should refer to the equipment’s scheduled operating hours, not all hours in a day or week. For example, if a machine is only scheduled to work eight hours per day, only those hours count toward the equipment’s availability for utilization calculations.
Contractors typically measure utilization through two primary methods: manual tracking systems or automated telematics solutions. Each approach offers different levels of accuracy, effort required, and insights gained.
Measuring Manually
Manual measurement requires careful record-keeping. It’s a common method for smaller fleets or companies just beginning to track equipment utilization data. It is also often used by contractors that want to be precise about the phase code costing on a contract, but it has some obvious limitations.
Daily Engine-Hour Logs
Field personnel or equipment operators record beginning and ending engine hours daily. Then, this approach requires staff to physically check hour meters and document readings at consistent intervals. Equipment managers can keep these logs on paper forms or basic spreadsheets, as long as they diligently follow through to maintain accuracy.
Daily logs are prone to errors such as transposition, incorrect inputs and omissions when the paper gets lost.
QR Code and Digital Form Systems
A more modern manual approach uses QR codes affixed to equipment that operators scan at the beginning and end of shifts. When scanned, these codes open digital forms (like Google Forms) where operators input usage details. This method creates digital timestamps and reduces transcription errors compared to paper logs.
Excel Dashboard Tracking
Equipment managers then consolidate data from paper logs or digital forms into Excel spreadsheets for analysis. With some spreadsheet knowledge, they can create dashboards that calculate equipment utilization rates and visualize trends over time. Excel templates can help standardize this process, though they still require someone to regularly input and maintain the data.
The main challenges with manual tracking include human error, inconsistent reporting, and the time lag between data collection and analysis. This can delay decision-making and prevent teams from acting on trends in real time.
Using Telematics
Telematics systems provide automated, real-time equipment monitoring through hardware devices connected directly to your machines. These systems collect precise operational data directly from equipment engines and control modules. Telematics devices track engine hours as well as the equipment’s location, fuel consumption, idle time, and even operational patterns that indicate productivity.
The hardware components typically include:
-
- GPS receivers for location tracking
- Engine control module connections for performance data
- Cellular or satellite transmitters to send equipment uptime and usage data to cloud servers
Equipment management platforms like Tenna use GPS asset trackers to monitor equipment run time in hours or miles and collect utilization data directly from your equipment’s engines. The system allows you to define custom utilization benchmarks and thresholds to easily visualize when assets are underutilized based on metrics relevant to your fleet size and current workload.
Through analytics tools, dashboards, and reports, Tenna provides both high-level views of both individual asset utilization as well as utilization per site, and detailed real-time data that you can sort and filter by equipment category or model. This helps operations teams, cost accountants, and equipment managers make informed decisions about job costing and owning, renting, or selling assets. It also helps estimators accurately estimate utilization when bidding on similar work.
Turning Data into Utilization Improvements
Once you’ve established a consistent method to measure equipment utilization data, put the information to work. Follow these steps to increase your fleet’s productivity:
1. Track Patterns and Identify Outliers
Review utilization reports to identify pieces of equipment that fall below established thresholds. Set custom benchmarks specific to your fleet size and current workload. Look for patterns across similar equipment types, projects, or seasons. This way you can prioritize improvements where they’ll have the greatest financial impact.
2. Diagnose Root Causes
Determine the cause of low utilization, which usually stems from operational issues that you can identify through your data:
-
- Excessive Engine Idling: Equipment running but not performing productive work, consuming fuel and accumulating engine hours without productive output.
- Maintenance Downtime: Unplanned breakdowns and repairs increase equipment downtime and keep equipment unproductive longer than necessary, often due to deferred maintenance.
- Jobsite Logistics Issues: Equipment sitting unused due to workflow bottlenecks, material delivery delays, or site access problems.
- Poor Deployment Decisions: Equipment remaining at completed jobsites or being hoarded on sites where they are no longer needed instead of being relocated to active projects where they can be operated.
- Fleet Redundancy: Maintaining multiple similar machines across different sites when fewer units could handle the actual workload if properly scheduled.
3. Prioritize and Implement Fixes
Address utilization issues starting with changes that deliver meaningful improvements:
-
- Optimize Equipment Scheduling: Use location tracking data and current utilization metrics to improve scheduling across projects, ensuring equipment moves efficiently from one job to the next without extended downtime.
- Implement Proactive Preventive Maintenance: Schedule regular maintenance during natural project downtimes based on engine hour tracking or calendar dates.
- Train Equipment Operators: Educate teams on proper equipment usage practices and establish protocols for shutting down machines when not in active use.
- Reassess Fleet Composition: Make strategic decisions about selling underutilized assets, returning rentals on time, avoiding rentals with better visibility over owned assets that can be deployed, and redeploying equipment to more active projects when their functions are complete on their current site.
- Standardize Site Logistics: Develop consistent processes for equipment receiving, staging, and operation across all projects to minimize idle time.
4. Remeasure and Refine
After implementing changes, continue monitoring utilization metrics to measure improvements and identify any new issues. Establish regular review cycles to ensure sustained progress and gradually tighten utilization targets as your processes improve.
Doing all of this manually is time consuming and overwhelming. Between collecting data from multiple sources, creating meaningful reports, diagnosing problems across dozens or hundreds of assets, and coordinating improvements across teams, the process can quickly become unmanageable without the right tools.
How Platforms Like Tenna Help Contractors Get Smarter About Utilization
With a construction equipment utilization platform like Tenna, you can transform utilization tracking from a manual process to an automated system that delivers actionable insights for making significant fleet management decisions. Tenna’s utilization tracking software is built specifically for construction teams managing mixed asset fleets.
“Tenna increased the quality of communication between decision makers while reducing the quantity of communication. Unnecessary and redundant phone calls and emails have been cut out of our workflow. Less time is spent tracking equipment and more energy can go into how equipment will be utilized and maintained.”
-Pat L., Project Manager, Severino Trucking
Real-Time Telematics Data
The Tenna platform retrieves your telematics data directly from Tenna GPS trackers installed in motorized assets across your mixed fleet. This automated connection provides accurate utilization metrics for all your construction assets in one unified platform, eliminating the guesswork and manual errors of traditional tracking methods.
Power Take Off (PTO) Monitoring
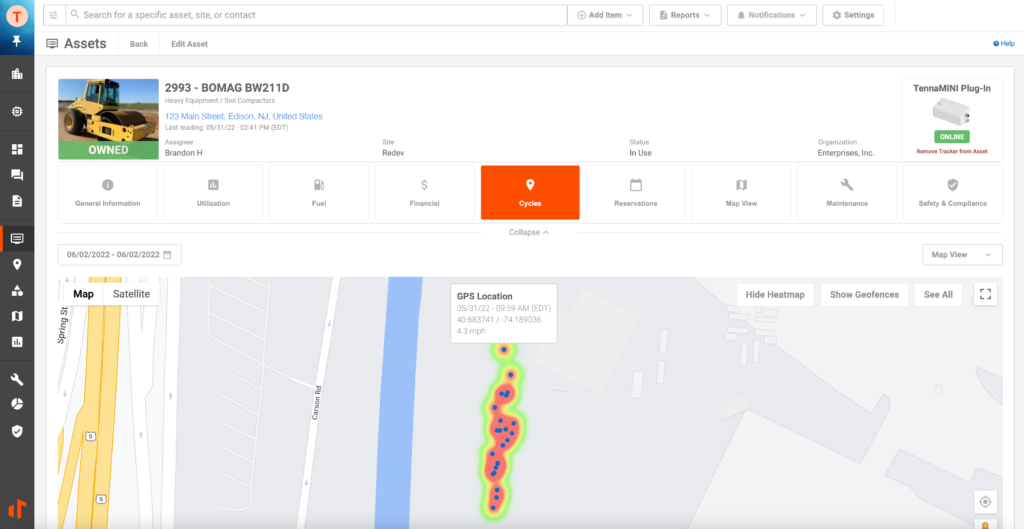
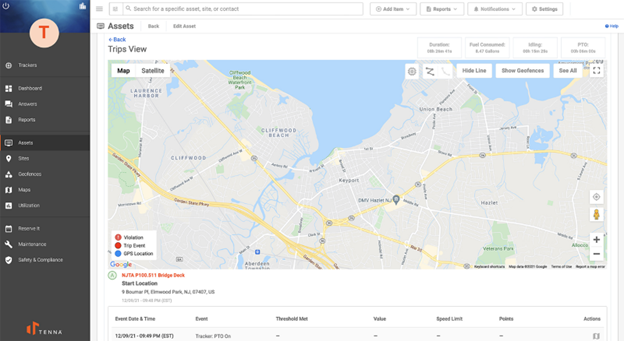
Tenna captures when equipment engines are used for activities other than simply running the asset. Users can monitor PTO status in real-time on maps and review Trip or Cycle Events showing PTO Engagement and overall PTO duration. This distinction between idle running and productive work provides a true picture of equipment productivity.
Custom Utilization Benchmarks
The system lets contractors define utilization benchmarks tailored to their specific fleet size and workload. These customizable thresholds make it easy to identify underutilized assets at a glance, helping managers quickly spot equipment that isn’t meeting performance standards.
Comprehensive Reports & Analytics
Equipment managers can identify trends over time through equipment usage reporting segmented by asset, and project. These analytics measure how often assets are working versus sitting idle, enabling data-driven decisions about scheduling, dispatching, and fleet composition.
For customers like Boudreau Pipeline Corporation, Tenna provides:
“Total visibility into machine population, how we’re using it, and utilization. With the information produced out of Tenna Idle Reports, BPC estimates saving somewhere between $15,000 to $19,000 per month and better communication amongst the team. And that is in depreciation fuel idle time reduction.”
-John G., Equipment Manager, Boudreau Pipeline Corporation
Proactive Maintenance Tracking
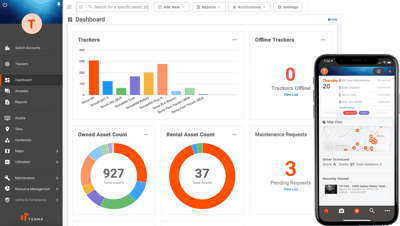
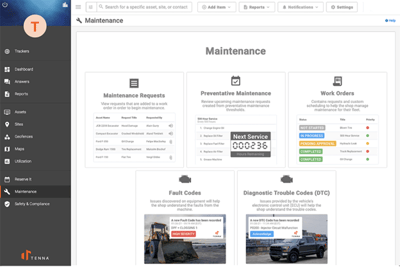
Avoid unexpected downtime with Tenna’s proactive maintenance tracking. Users can set asset usage triggers to receive automated alerts about maintenance needs. Tenna provides a convenient dashboard to monitor maintenance requests, work orders, and preventive maintenance needs, helping ensure equipment stays in optimal working condition.
Third-Party Tool Integrations
Tenna integrates with third-party original equipment manufacturers (OEMs) to sync telematics and utilization data directly with the platform via the AEMP feed. This connection centralizes telematics information from multiple sources into one comprehensive system.
Takeaways
By providing complete visibility into equipment usage patterns, Tenna helps contractors make informed decisions about owning, operating, renting, or selling equipment. The platform transforms raw utilization data into strategic insights that drive cost savings, improve operational efficiency, and maximize the return on equipment investments.
See how Tenna’s construction equipment utilization platform can help you get more from your mixed fleet.

About William Hipp
As a Product Analyst for Tenna, Will supports the product roadmap and manages the lifecycle from idea conception to production. With a decade of experience as a Certified Public Accountant in Big Four accounting, multinational manufacturing, and construction equipment management, Will has developed a strong foundation in finance and analytics. During his four years in construction equipment management, he utilized his analytical skills to build robust models that leverage leading and lagging indicators to inform strategic decisions. These decisions include identifying the optimum ownership period, setting accurate equipment rates, and making data-driven choices regarding repair, replacement, and disposal strategies. His commitment to excellence and efficiency ensures that Tenna is grounded in solid analytical practices aimed at providing strategic insights.
