A practical, field-tested approach for building an accurate owning and operating rate, including a path forward if you don’t have any data captured and analyzed yet.
Every equipment purchase decision starts with the same question: “What is this machine actually going to cost us to own and operate over its life?”
The sticker price is the easy part. The hard part is determining the overall cost after that, including fuel, maintenance costs, repairs, downtime, insurance, storage, and the eventual resale or scrap value.
Get Total Cost of Ownership (TCO) wrong, and you’ll put the business at risk by:
- Overbidding jobs, which leads to losing the opportunity
- Underbidding jobs, which leads to leaving money on the table
- Misallocating costs across jobs
- Hanging onto assets to the point where they become liabilities
Much of the foundational thinking on this topic traces back to Mike Vorster, author of Construction Equipment Economics and the David H. Burrows Professor of Construction Engineering at Virginia Tech.
Vorster’s work treats the fleet as a portfolio of financial assets, building an internal rental rate for each asset, tracking economic life and minimum lifecycle cost, and using operational performance indicators to identify when a machine has become a drag on the fleet’s finances.
The practical TCO rate-building approach below is built in that spirit, leveraging data most contractors and fleet owners can actually get their hands on. It’s a field-adapted approach informed by Vorster’s core principle: you need to know your cost before you can manage a fleet decision.
“The accuracy and quality of the rate calculation depend on the accuracy and quality of the cost estimates used, not on the complexity or sophistication of the method used to perform the calculation.” — Mike Vorster, Construction Equipment Economics v2, Pg. 81
Why Total Cost of Ownership Modeling Is Harder for Heavy Equipment Than It Looks
Heavy equipment doesn’t depreciate or wear out in a straight line. A wheel loader that sits for six months and then runs 1,000 hours in a single year wears differently than one that runs steadily year-round for 2,000 hours. This is something equipment dealers and auction houses know well.
Component life is tied to hours and duty cycle, not calendar time. Resale value swings with commodity cycles, construction demand, and even auction timing. Fuel, parts and labor costs are subject to inflationary pressure.
That variability is exactly why so many TCO models fall apart: They’re built once off limited assumptions and never updated. A good total cost of ownership model is a living calculation that gets more accurate each year you own the asset, which is where fleet and asset tracking data becomes essential, as you’ll see later in this article.
Building the TCO Rate: A Three-Pillar Approach
There are great guides available for building a rate based on your own data. But what can you do when you don’t have reliable historical data to leverage?
The core idea here is simple, and it echoes Vorster’s emphasis on knowing your cost before you can manage it. You can reverse-engineer a rate from data that already exists in the market, then layer in your own operating specifics.
No matter which data source you start from, everything in this model eventually resolves to a single number: cost per operating hour. Keep that destination in mind as you work through each of the three pillars.
Pillar 1: Start With the External Rental Rate, Discounted ~40%
Rental houses have already priced in the owning and operating costs you would otherwise have to model yourself. Their daily, weekly, and monthly rental rates are built to cover:
- Depreciation and cost of capital
- Maintenance and repair reserves
- Insurance and compliance
- Transport, yard and management overhead
- Assumed utilization and/or deployment
- Profit margin (typically the largest single markup layer)
As the rental rate bakes in the components above, there is one that an owner-operator doesn’t carry in the same way. Profit margin.
Pull the going external rental rate for the make/model/class of equipment and discount it by roughly 40%.
This isn’t an arbitrary haircut, rather it is pulled from an objective source: The largest rental houses are publicly traded on stock exchanges, and as a requirement they must disclose their financial information. Per review of those income statements, gross margin typically falls somewhere between 38% and 48%. Granted that is a mix across all of their machine classes and regions, but it serves a solid baseline that can be used to back into the starting point for a rate.
The end result gives you a benchmark hourly or daily TCO rate before you’ve run a single hour on the machine. Treat it as a sanity-check ceiling and a starting point for every other calculation in the model.
If a 20-ton excavator rents externally for $820/day, $2,120/week, or $5,550/month, which time frame should you use?
That is up to the operational reality of your business. How many days out of the year do you expect this machine to be deployed in the field building work? If it is sporadic, you may want to rely on the daily rate. If it is constant, you may want to rely on the monthly rate.
Here is why: The daily rate assumes 8 hours, the weekly rate assumes 40 hours and the monthly rate assumes 160 hours. That translates into a wide array from the perspective of hourly cost.
| Daily | Weekly | Monthly | |
|---|---|---|---|
| Rate | $820 | $2,120 | $5,550 |
| Assumed Hours | 8 | 40 | 160 |
| Hourly Rate | $102.50 | $53.00 | $34.69 |
| Discounted Rate (~40%) | $61.50 | $31.80 | $20.81 |
Notice the spread. The same machine benchmarks anywhere from roughly $21 to $62 per hour depending on which rental period you anchor to. Match the rental period to your realistic deployment pattern. If you are not sure yet, model both ends and treat the benchmark as a range rather than a single number.
As mentioned, this is your starting point to compare against your own internal assumptions. If your internal assumptions come out dramatically higher than this benchmark, then investigate.
The rental rates don’t account for fuel. Keep fuel out of this benchmark entirely. If applicable, you will add fuel as its own line item in the final rate build. When you compare your modeled rate against this benchmark later, compare on a fuel-excluded basis, so you are comparing apples to apples.
Pillar 2: Work with Your Equipment Dealer on Component Replacement Timelines and Costs
Rental benchmarking gets you the macro number. Your relationship with the dealer helps you get the mechanics behind that number, like the specific wear components that will drive real cash outlay over the asset’s life.
Sit down with your OEM dealer or service rep to get specifics on:
- Engine and powertrain rebuild intervals and current parts/labor pricing
- Hydraulic component wear (pumps, cylinders, hoses) for the application and duty cycle you run
- Undercarriage life (tracks, rollers, idlers) and replacement cost by hour interval
- Tires for wheeled equipment, and expected life under your terrain/load conditions
- Scheduled maintenance and other wear parts cost (filters, fluids, PM intervals, emission systems maintenance) at current dealer labor rates
Build this into a simple component replacement calendar: Hour markers, expected parts & labor cost, and confidence level for each major wear item. This is the piece most TCO models skip, and it’s usually the single biggest source of “surprise” cost overruns four or six years into ownership.
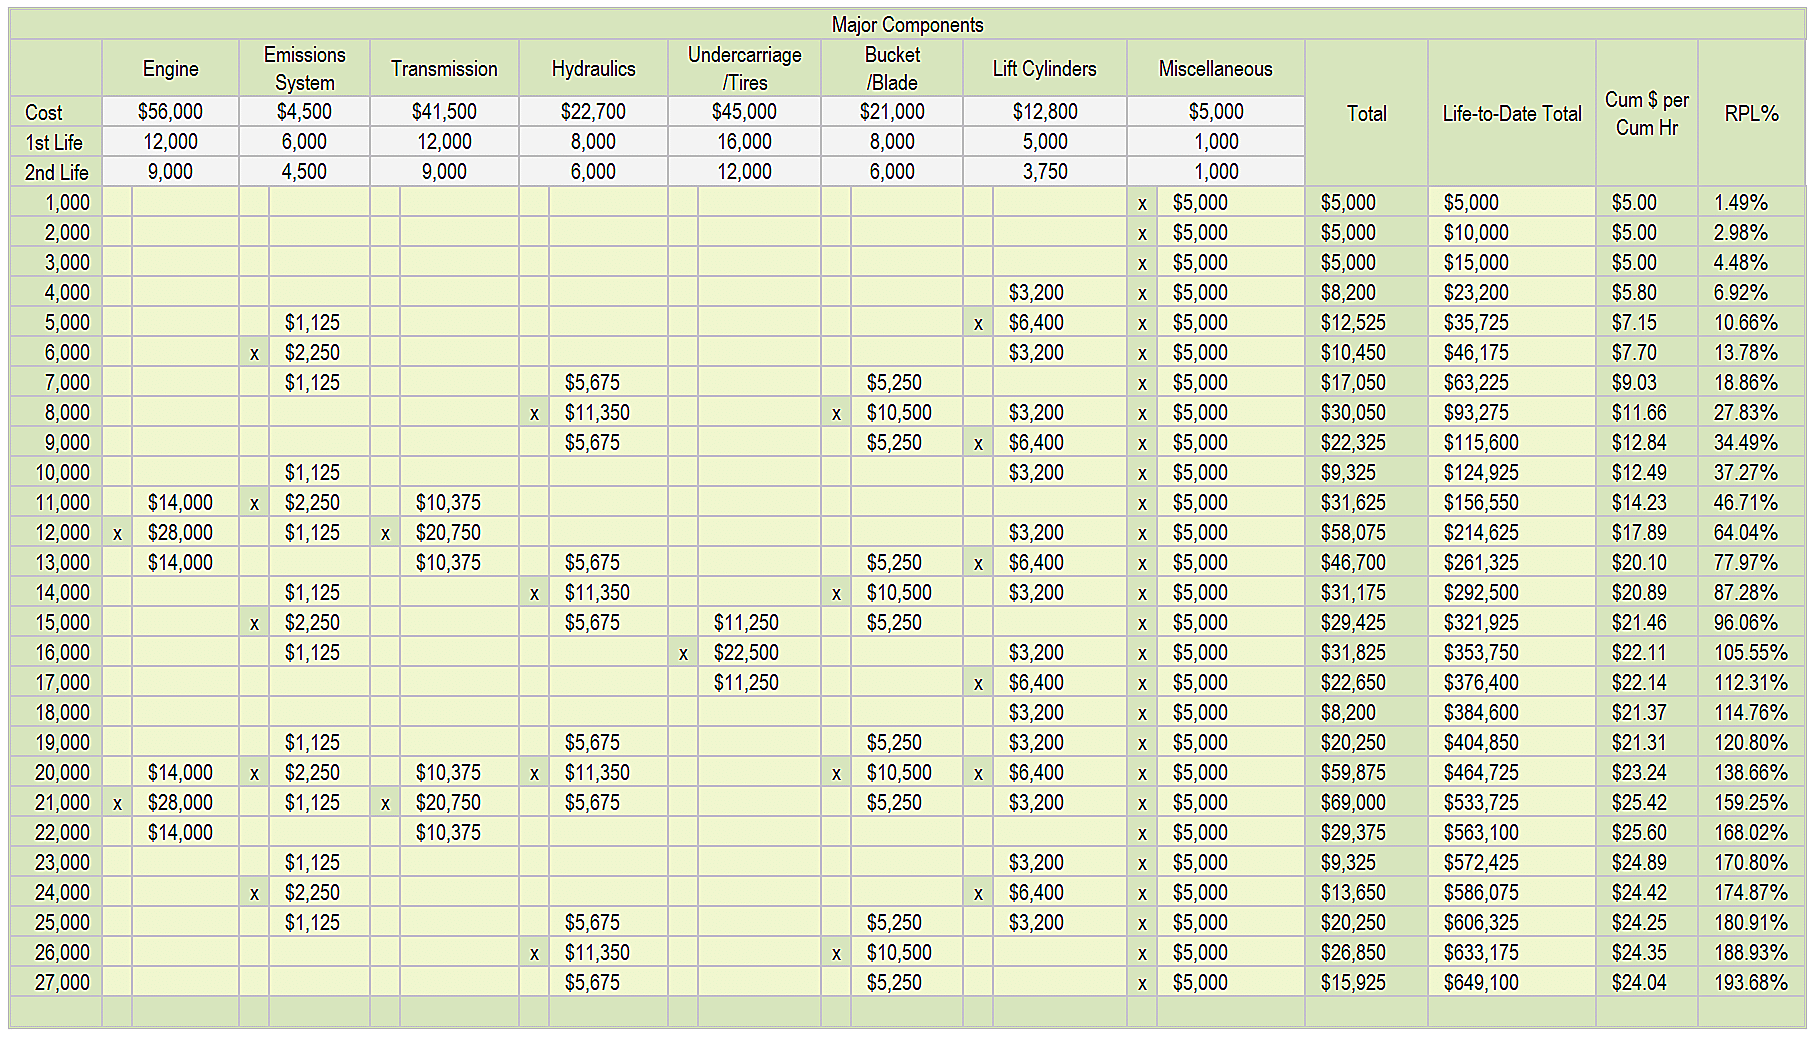
To learn more, see page 73 of Construction Equipment Economics v2 by Mike Vorster.
Pillar 3: Use Auction Data to Model Depreciation and End-of-Life Value
The other side of TCO is what you get back when you dispose of the asset. This is where market depreciation comes in, and it’s the piece most in-house models estimate the worst. Often times, companies pick a single point to sell and they have limited historical information (if they’ve even collected it). When modeled correctly, leveraging auction house information can provide insights as to what the sold machine might return based on various age ranges.
Pull comparable sale price data from auction and resale marketplaces (Ritchie Bros, IronPlanet, Machinery Trader, and similar sources) for:
- The same make/model/configuration
- Comparable age and hour ranges
- Comparable condition and region
Plot that data across hours to build a residual market value curve specific to that equipment class.
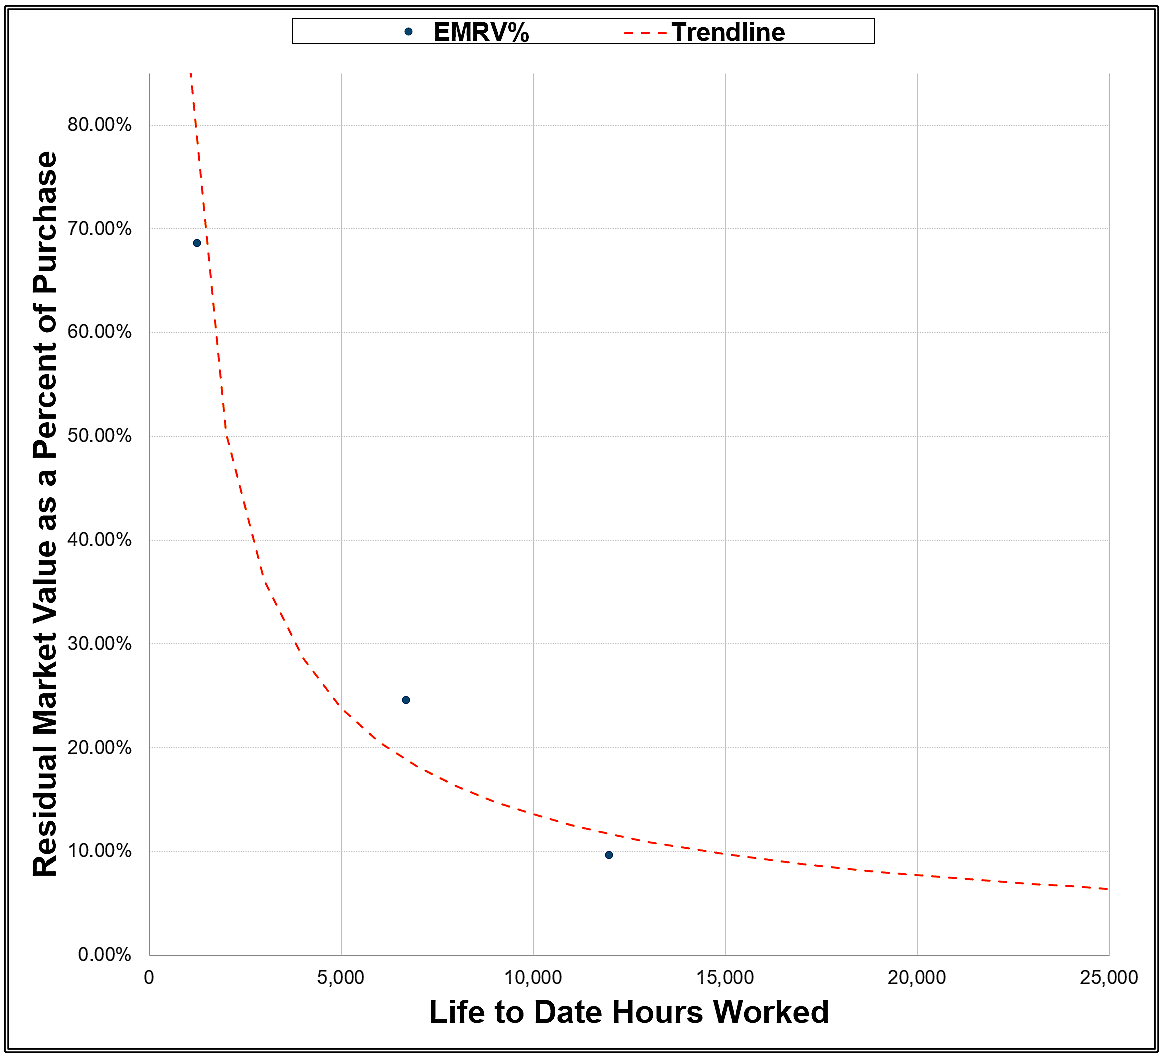
To learn more, see pages 58-60, Construction Equipment Economics v2.
Auction data reflects what buyers are actually paying today, which is more current than what you got for a machine you sold three years ago. Pulling a few data points can supply a trend line that gives you total depreciation per hour at any point during the asset’s life.
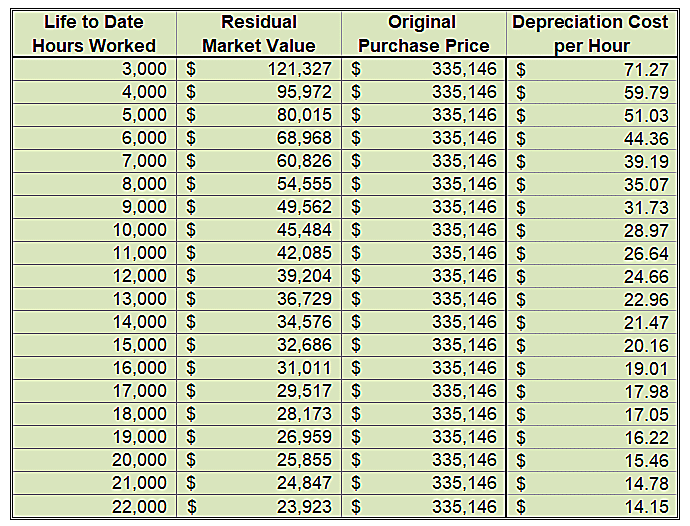
Putting the Total Cost of Ownership Model Together
Once you have all three pillars, your TCO rate approach looks roughly like this:
| Cost Component | Data Source | How It’s Used |
|---|---|---|
| Benchmark TCO rate | External rental rate × ~0.60 (i.e., ~40% discount) | Sanity-check ceiling for total modeled rate |
| Depreciation (purchase – residual value) | Bill of sale plus auction comps | Right to use cost; divide by total lifetime hours |
| Insurance, financing, storage, compliance | Internal overhead accounting | Annual cost of keeping the unit in the fleet legally; divide by annual hours |
| Component replacement reserve | Dealer component life and cost estimates | Reserve for non-routine repairs; divide by total lifetime hours |
| Fuel consumption | Cost per gallon and OEM burn rate | Direct cost per operating hour; no conversion needed |
| Scheduled maintenance | Dealer PM schedule & other wear items (tires, tracks, ground engaging tools) | Cost per service interval; divide by interval hours |
Total Cost of Ownership ≈
(Purchase – Residual Value) / Total Life in Hours
+ (Insurance, Financing, Storage & Compliance) / Annual Hours
+ Expected Component Replacements / Total Life in Hours
+ (Routine Service Cost / Service Interval in Hours)
+ (Fuel Cost per Gallon × Engine Fuel Burn Rate)
The final output expressed per hour, then checked against your rental-rate benchmark from Pillar 1 (be sure to exclude fuel when comparing against your benchmark).
What If You Don’t Have Any Equipment Data Yet?
Most fleets run into this exact wall: Evaluating a new equipment type, entering a new market, or simply not having enough owned-asset history analyzed yet to model confidently. A credible starting model doesn’t require years of data. It requires leaning harder on the three external pillars until your own data catches up.
Here’s how to build a first-pass total cost of ownership model with zero internal history:
- Lean fully on the discounted rental benchmark. With no internal cost history, the ~40%-discounted external rental rate becomes your primary anchor rather than a sanity check.
- Get dealer quotes in writing before you buy. Ask for the same component replacement schedule and cost data described above. Most dealers can pull this from fleet-wide service records, giving you real-world intervals grounded in actual usage.
- Use auction comps for a similar class of machine, even if it’s not an exact match. A close proxy (e.g., similar size class, different make, similar application) gets you a usable depreciation curve. The only wrong answer for residual market value is $0.
- Apply industry rule-of-thumb ratios most OEMS have literature that you can refer to. Flag these clearly as placeholder assumptions to be replaced with real data later on.
- Collect data from day one. The moment the machine is in your fleet, start capturing engine hours, utilization, fuel burn, and maintenance events. This is non-negotiable if you want your model to improve.
The goal is a defensible, data-informed model that gets less assumption-heavy every time it is revisited.
Keep the TCO Model Alive With Real Fleet Data
A TCO model built once and filed away goes stale quickly. The real return on investment comes from feeding it real operating data as the asset accrues hours: utilization, deployment, actual fuel burn, maintenance events, and location/usage patterns that affect wear.
A fleet tracking platform like Tenna captures actual engine hours, location, utilization, deployment and maintenance events continuously, then ties maintenance events, work orders, mechanic labor, and parts costs to the same asset record.
Asset Financials takes it a layer further by rolling operating costs up against each asset and attributing usage to the jobs it worked. In other words, everything needed to capture the actual owning and operating cost per hour, and per job, for the machine.
By automating all of this, when it’s time to revisit your TCO model, the inputs you need are already assembled against the machine instead of scattered across systems.
This gives you real numbers to replace your Pillar 1–3 assumptions over time, effectively closing the loop:
- Pillar 1 started with a discounted rental rate and an assumed number of deployed hours. Actual utilization and deployment data tells you what the machine really ran.
- Pillar 2 started with dealer estimates for component life and repair cost. Your own maintenance history, including work order costs, parts, and mechanic labor, tells you what those components actually cost on your jobs, under your duty cycles.
- Pillar 3 started with an auction-comp depreciation curve. Real accrued hours and documented service history tell you where a specific machine sits on that curve.
A benchmark-driven estimate on day one becomes an increasingly precise, asset-specific TCO model by year three or four, built on your fleet’s actual behavior.
Key Takeaways
- Start your TCO rate with the external rental rate discounted by roughly 40% as a benchmark.
- Partner with your equipment dealer to map real component replacement timelines and costs. This is usually the biggest blind spot in DIY models.
- Use auction/resale data to build a realistic depreciation and end-of-life value curve instead of relying on generic book depreciation.
- If you have no historical data captured and analyzed yet, weigh the model toward these three external sources and commit to instrumenting the asset from day one.
- Automate equipment management to capture utilization, engine hours, fuel, and maintenance data in real time.
- Treat your TCO model as a living calculation. Refine it continuously with real utilization and maintenance data as it updates.
Getting TCO right means building a good-enough model today, plus a mechanism to make it better every month the equipment is in your fleet.