Data Analytics in Construction
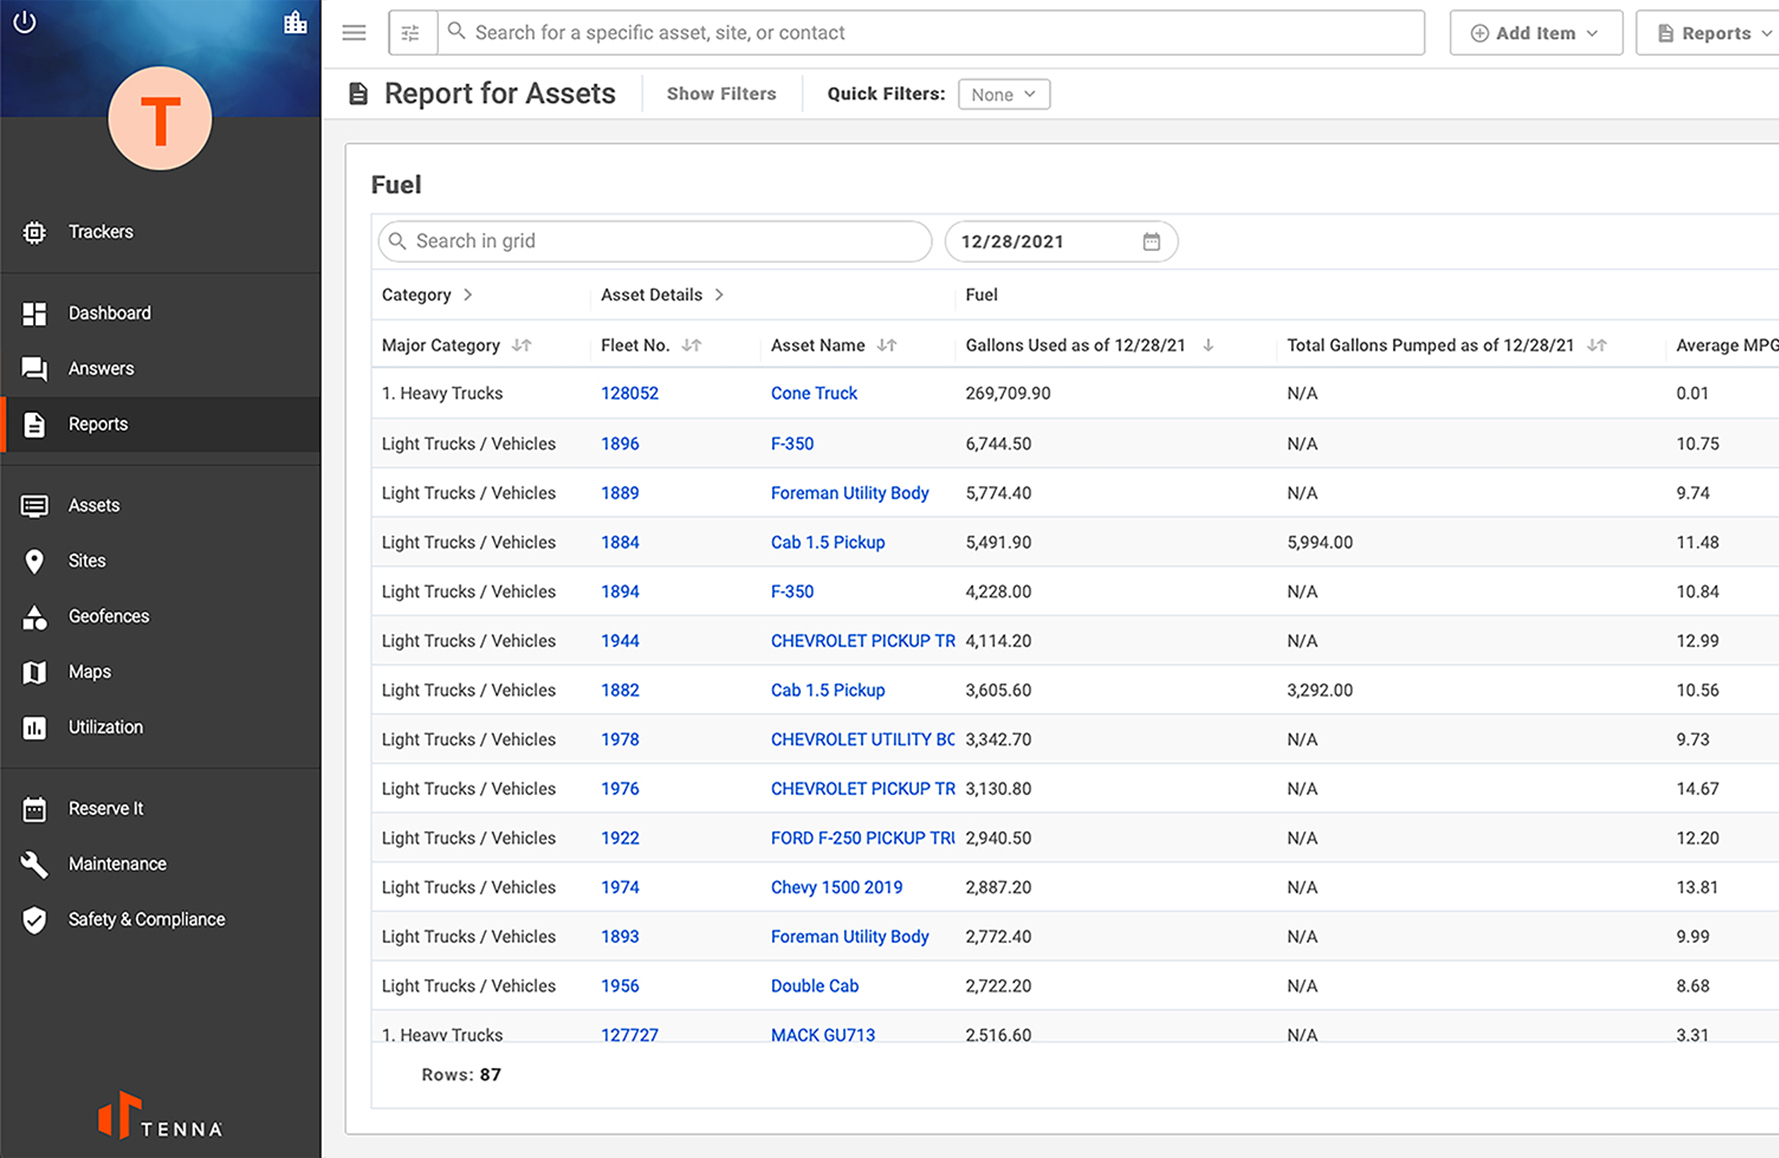
Reports
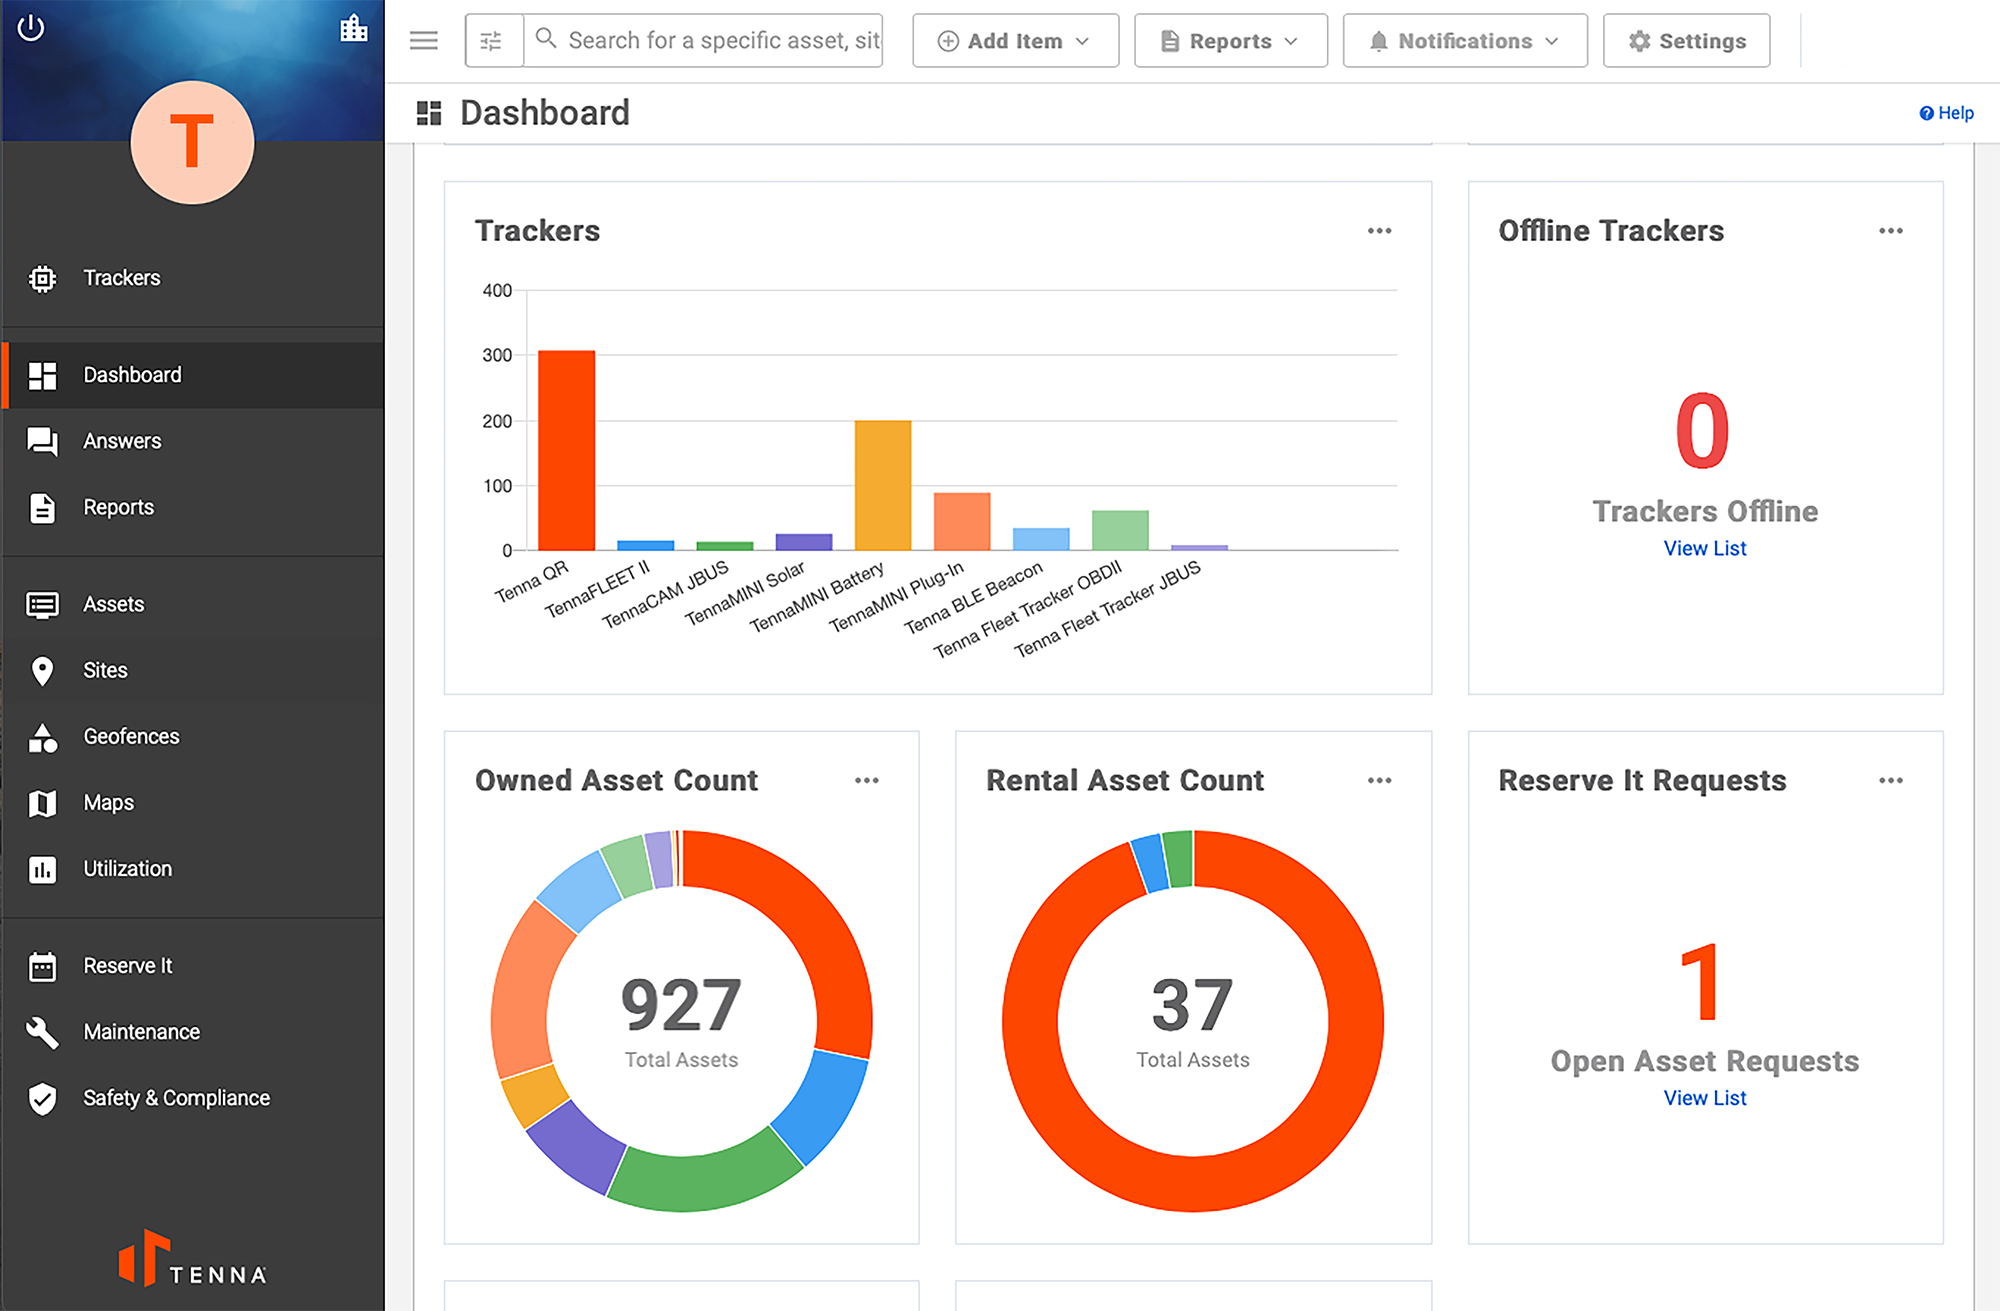
Dashboard
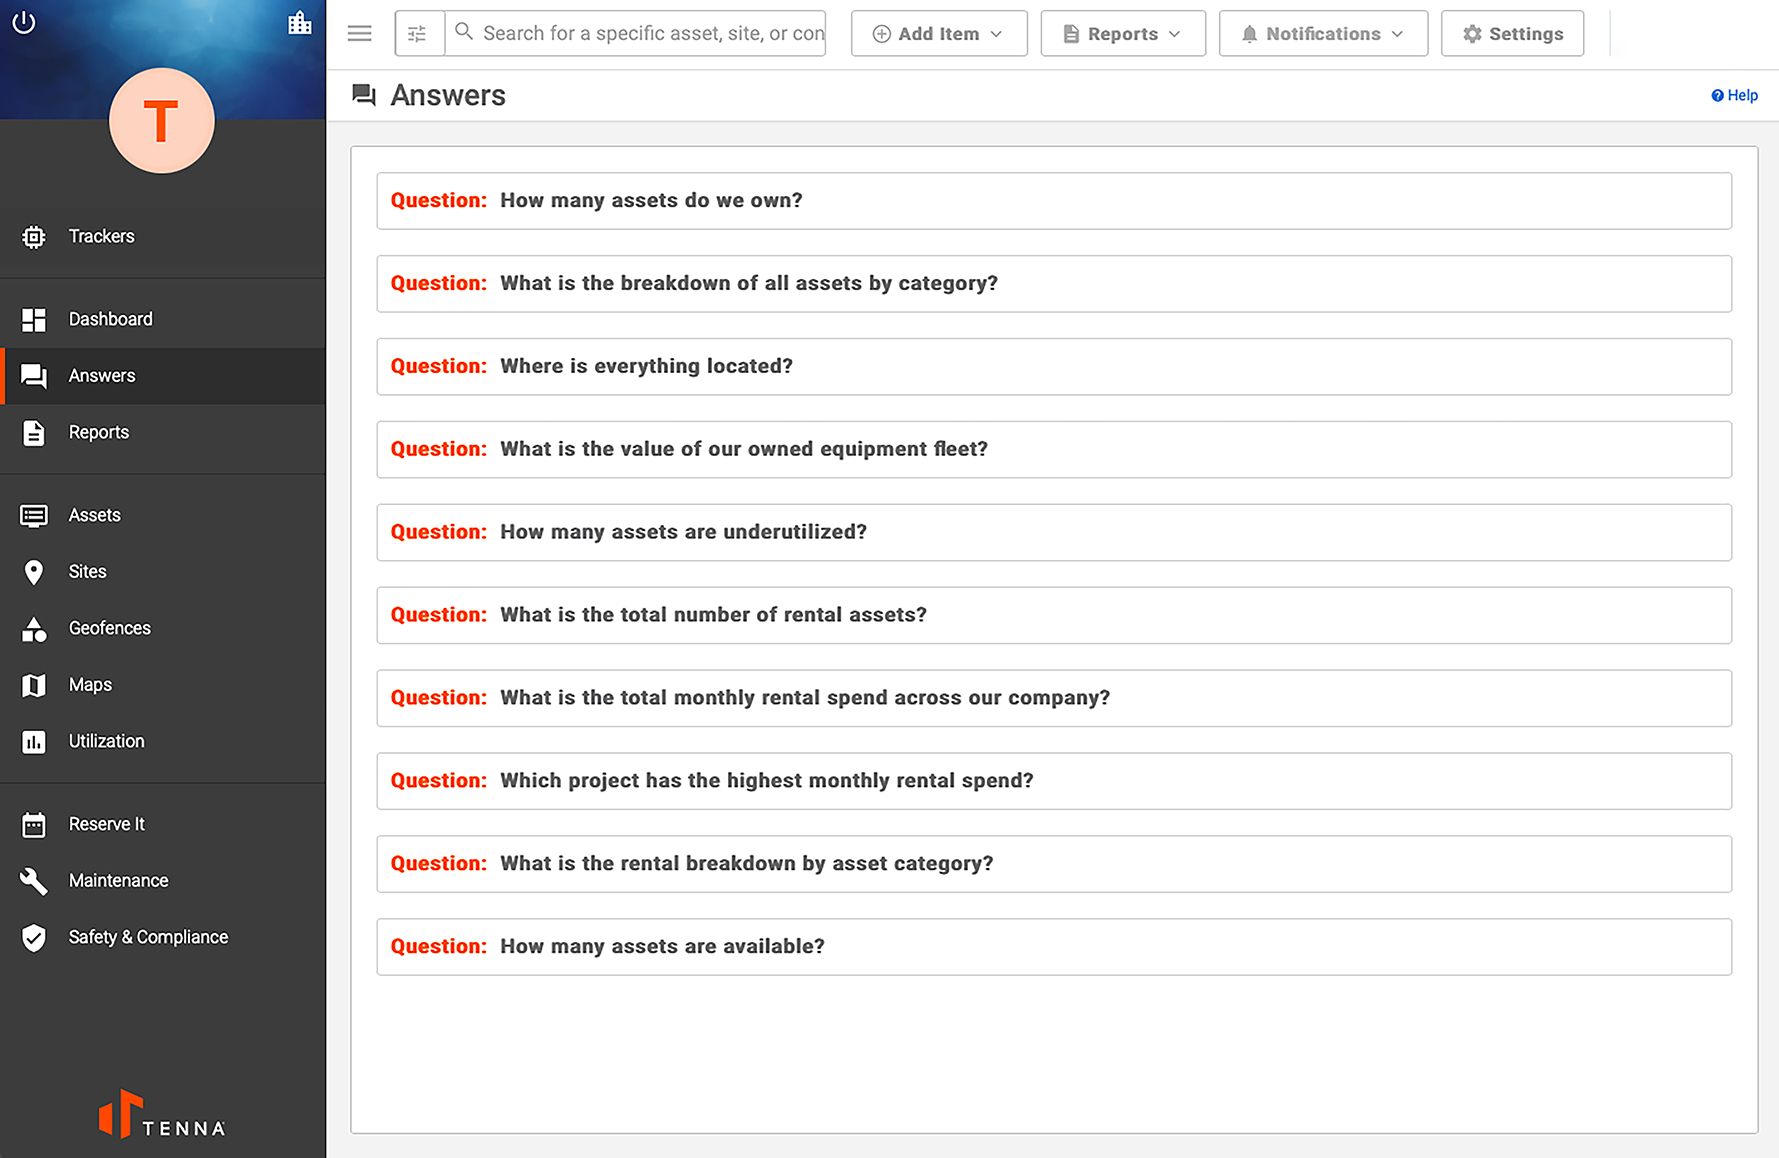
Answers
Meaningful Construction Data Analytics
Data analytics in construction generate valuable information you need to monitor, operate and maintain your fleet. But what good is this data if you can’t easily digest and use it?
Tenna’s construction data analytics tools are a powerful component of the basic equipment management software functionality. View quick answers to relevant questions from the Answers feature, see metrics on screen on your Dashboard, and slice and dice your data in the Reports engine to export the equipment utilization and performance insights you are looking for.
How Construction Analytics Software Works
Dashboard
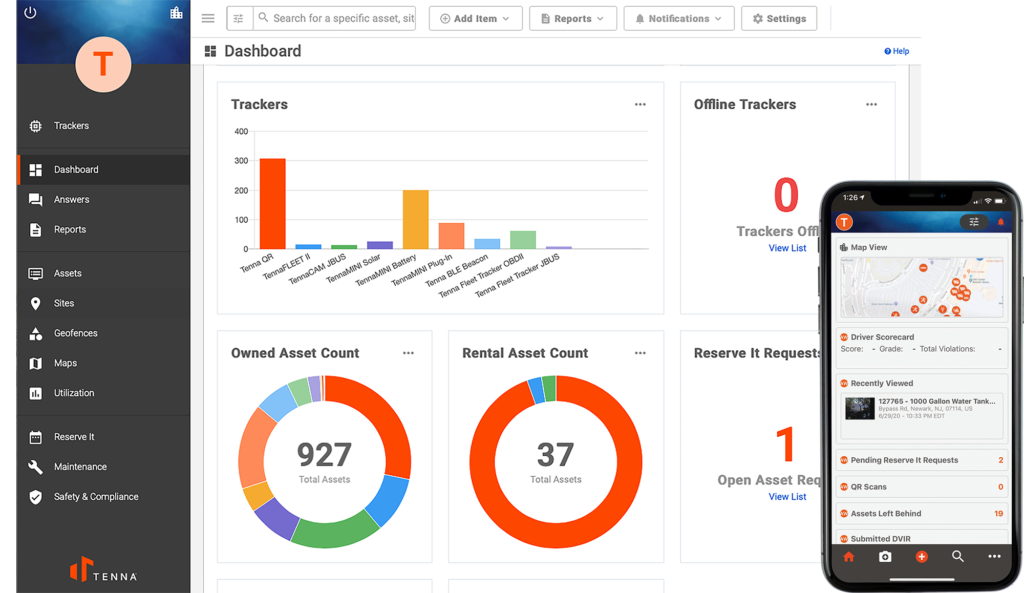
See your equipment fleet’s key metrics with interactive and responsive graphs and charts. See only the metrics that matter the most based on roles and permissions, and drill in to get more granular, actionable information on how your assets are being used, what they are costing you and what you may need to act on.
Answers
Get quick, straightforward answers to fundamental and insightful questions on your equipment fleet’s performance, cost and utilization in an easy to digest Q & A format. Link to reports for additional supporting details.
Reports
Report out on asset details, utilization, maintenance, financial info, geofence activity, tracker health and more. Extract data from reports and tables using advanced filtering, sorting and column functionality to zone in on the construction equipment data you need.
"Biggest value for me is Reports. I pull geofence enter and exit reports, and that helps me tremendously with invoicing, being more productive, and being more efficient and accurate on billing our customers."
Abigail C.
Power User, Rental Works
Benefits of Data Analytics in Construction
Increased Efficiencies and Productivity
- Save Time – Stop wasting time trying collect data from multiple systems and locations.
- Improve communication
- Increase visibility
Better Business
- Improve cost earnings and savings
- Improve decision making
- Improve forecasting
- Improve record keeping
Tenna Analytics Product Overview
Let's Talk Specs!
Book a Demo

